Updated NCUA Data Increases LID Eligibility to 62% of U.S.

The updated workbook opens new opportunities for credit unions to qualify for the low-income designation and access related benefits.

Luis G. Dopico and Trevor Moos

Published 

Jul 23


2025

View all posts by 

Luis G. Dopico and Trevor Moos

A squiggly pink arrow pointing downward and to the right.
a photograph of the seal of the national credit union association on a building

Credit unions serve the financial needs of members and communities of all incomes. To provide further incentives for credit unions to serve lower-income members and communities, Congress and the National Credit Union Administration (NCUA) have developed legislation and regulation (1) that identify some credit unions as low-income designated (LID) and (2) that provide several benefits (i.e., regulatory relief and funding) for LID credit unions.  

To help credit unions assess whether they quality for a low-income designation, the NCUA maintains, and updates, a Low-Income Designated Area Workbook which lists counties, census tracts, and census block groups where over 50% of residents either “have a family income of 80 percent or less than the median family income for the metropolitan area where they live or national metropolitan area, whichever is greater, or those members who earn 80 percent or less than the total median earnings for individuals for the metropolitan area where they live or national metropolitan area, whichever is greater.” The main way a credit union can obtain and maintain its LID status is by showing that more than 50% of its members live in LID qualifying counties, census tracts, or census block groups.

The benefits of being a LID credit union include:

  1. Authority to obtain supplemental capital (e.g., subordinated debt). Additional capital can both buttress financial solidity and accommodate larger deposit inflows.
  1. Ability to accept non-member deposits from any source (i.e., in addition to deposits from government organizations). The ability to accept non-member deposits can be particularly useful during mergers with credit unions and banks where all members and clients of the merging institutions do not readily fall within the field of membership of the continuing institution.
  1. An exemption from the statutory cap on member business lending, which expands access to capital for small businesses and helps credit unions to diversify their loan portfolios.
  1. Eligibility for grants and low-interest loans from the NCUA’s Community Development Revolving Loan Fund (CDRLF), particularly for smaller institutions.
  1. Special field of membership provisions for federal community and multiple common bond credit unions.

NCUA LID Area Workbook Update: Key Nationwide Changes for Credit Unions

NCUA’s most recent LID Area Workbook (released in 2025) is based on the U.S. Census Bureau’s 2023 American Community Survey (ACS) 5-year data and updates the previous workbook (released in 2024) which was based on 2022 ACS 5-year data. In figure 1, we sum the population in each county, census tract, and census block group identified by the NCUA as LID using 2022 and 2023 ACS 5-year data.

From 2022 to 2023, the number of US residents in LID qualifying geographies increased by 12.6 million, from 193.7 million to 206.2 million. At the same time, the percentage of the US population in LID qualifying areas increased by 3.9 percentage points, from 57.6% to 61.5%. Credit unions interested in seeking or maintaining their LID status may target new member outreach efforts toward the parts of their geographic fields of membership that are LID qualifying, including those that are newly LID qualifying.

Figure 1: Population in counties, census tracts, and census block groups identified by NCUA as LID, using 2022 and 2023 census data (in the 2024 and 2025 LID Area Workbooks)

LID Qualifying Population    
   
LID Qualifying Population
(% of Total U.S. Population)


2022   
   
2023   


2022   
   
2023   
   
County   
   
71,907,129   
   
73,128,104   


21.5   
   
21.8   
   
Census Tract   
   
151,128,055   
   
155,250,106   


45.2   
   
46.3   
   
Census Block Group   
   
139,208,273   
   
170,086,630   


41.6   
   
50.7   
   
Any of the above   
   
193,659,611   
   
206,240,316   


57.6   
   
61.5   
   
U.S.   population   
   
334,287,569   
   
335,562,576   


Sources: NCUA LID Area Workbook (2024 and 2025) and U.S. Census (2025).

NCUA LID Workbook Update: State-by-State Impacts on Credit Union Eligibility

Credit unions interested in seeking or maintaining their LID status can, of course, do so more readily in parts of the country with more LID qualifying areas. Figure 2 presents total and LID qualifying population, across states (and other US jurisdictions) in 2022 and 2023.

Figure 2: LID qualifying population: total and % of total population, 2022 and 2023


Total Population

LID Qualifying Population

LID Qualifying Population

(% of total population)

2022

2023

2022

2023

Change

2022

2023

Change
   
Alabama   
   
5,027,534   
   
5,053,685   
   
3,741,447   
   
3,914,008   
   
172,561   
   
74.4   
   
77.4   
   
3.0   
   
Alaska   
   
734,821   
   
733,971   
   
315,093   
   
358,805   
   
43,712   
   
42.9   
   
48.9   
   
6.0   
   
Arizona   
   
7,172,250   
   
7,268,175   
   
4,271,155   
   
4,494,915   
   
223,760   
   
59.6   
   
61.8   
   
2.3   
   
Arkansas   
   
3,018,669   
   
3,032,651   
   
2,251,220   
   
2,378,051   
   
126,831   
   
74.6   
   
78.4   
   
3.8   
   
California   
   
39,356,034   
   
39,242,785   
   
21,577,251   
   
22,892,269   
   
1,315,018   
   
54.8   
   
58.3   
   
3.5   
   
Colorado   
   
5,770,790   
   
5,810,774   
   
2,689,977   
   
2,968,769   
   
278,792   
   
46.6   
   
51.1   
   
4.5   
   
Connecticut   
   
3,611,317   
   
3,598,348   
   
1,242,473   
   
1,506,354   
   
263,881   
   
34.4   
   
41.9   
   
7.5   
   
Delaware   
   
993,635   
   
1,005,872   
   
486,160   
   
563,284   
   
77,124   
   
48.9   
   
56.0   
   
7.1   
   
District of Columbia   
   
670,579   
   
672,079   
   
324,345   
   
335,266   
   
10,921   
   
48.4   
   
49.9   
   
1.5   
   
Florida   
   
21,634,529   
   
21,928,881   
   
15,841,040   
   
16,462,371   
   
621,331   
   
73.2   
   
75.1   
   
1.9   
   
Georgia   
   
10,722,325   
   
10,822,590   
   
6,701,866   
   
7,082,140   
   
380,274   
   
62.5   
   
65.4   
   
2.9   
   
Hawaii   
   
1,450,589   
   
1,445,635   
   
602,757   
   
669,930   
   
67,173   
   
41.6   
   
46.3   
   
4.8   
   
Idaho   
   
1,854,109   
   
1,893,296   
   
1,300,572   
   
1,400,728   
   
100,156   
   
70.1   
   
74.0   
   
3.8   
   
Illinois   
   
12,757,634   
   
12,692,653   
   
6,197,289   
   
6,701,587   
   
504,298   
   
48.6   
   
52.8   
   
4.2   
   
Indiana   
   
6,784,403   
   
6,811,752   
   
4,309,184   
   
4,522,099   
   
212,915   
   
63.5   
   
66.4   
   
2.9   
   
Iowa   
   
3,188,836   
   
3,195,937   
   
1,455,905   
   
1,610,838   
   
154,933   
   
45.7   
   
50.4   
   
4.7   
   
Kansas   
   
2,935,922   
   
2,937,569   
   
1,435,192   
   
1,556,223   
   
121,031   
   
48.9   
   
53.0   
   
4.1   
   
Kentucky   
   
4,502,935   
   
4,510,725   
   
3,012,433   
   
3,123,796   
   
111,363   
   
66.9   
   
69.3   
   
2.4   
   
Louisiana   
   
4,640,546   
   
4,621,025   
   
3,667,774   
   
3,785,079   
   
117,305   
   
79.0   
   
81.9   
   
2.9   
   
Maine   
   
1,366,949   
   
1,377,400   
   
583,359   
   
685,501   
   
102,142   
   
42.7   
   
49.8   
   
7.1   
   
Maryland   
   
6,161,707   
   
6,170,738   
   
3,433,833   
   
3,610,677   
   
176,844   
   
55.7   
   
58.5   
   
2.8   
   
Massachusetts   
   
6,984,059   
   
6,992,395   
   
3,338,108   
   
3,615,211   
   
277,103   
   
47.8   
   
51.7   
   
3.9   
   
Michigan   
   
10,057,787   
   
10,051,595   
   
6,159,901   
   
6,457,107   
   
297,206   
   
61.2   
   
64.2   
   
3.0   
   
Minnesota   
   
5,695,292   
   
5,713,716   
   
2,378,235   
   
2,595,244   
   
217,009   
   
41.8   
   
45.4   
   
3.7   
   
Mississippi   
   
2,958,846   
   
2,951,438   
   
2,309,666   
   
2,342,466   
   
32,800   
   
78.1   
   
79.4   
   
1.3   
   
Missouri   
   
6,154,422   
   
6,168,181   
   
3,619,882   
   
3,854,052   
   
234,170   
   
58.8   
   
62.5   
   
3.7   
   
Montana   
   
1,091,840   
   
1,105,072   
   
628,371   
   
670,236   
   
41,865   
   
57.6   
   
60.7   
   
3.1   
   
Nebraska   
   
1,958,939   
   
1,965,926   
   
821,201   
   
895,764   
   
74,563   
   
41.9   
   
45.6   
   
3.6   
   
Nevada   
   
3,104,817   
   
3,141,000   
   
1,667,173   
   
1,837,053   
   
169,880   
   
53.7   
   
58.5   
   
4.8   
   
New Hampshire   
   
1,379,610   
   
1,387,834   
   
628,229   
   
705,748   
   
77,519   
   
45.5   
   
50.9   
   
5.3   
   
New Jersey   
   
9,249,004   
   
9,267,014   
   
3,971,246   
   
4,309,960   
   
338,714   
   
42.9   
   
46.5   
   
3.6   
   
New Mexico   
   
2,112,463   
   
2,114,768   
   
1,571,743   
   
1,648,950   
   
77,207   
   
74.4   
   
78.0   
   
3.6   
   
New York   
   
19,913,488   
   
19,793,038   
   
11,106,126   
   
11,721,692   
   
615,566   
   
55.8   
   
59.2   
   
3.4   
   
North Carolina   
   
10,470,214   
   
10,584,340   
   
7,141,344   
   
7,473,144   
   
331,800   
   
68.2   
   
70.6   
   
2.4   
   
North Dakota   
   
776,874   
   
779,361   
   
301,327   
   
333,424   
   
32,097   
   
38.8   
   
42.8   
   
4.0   
   
Ohio   
   
11,774,625   
   
11,780,046   
   
6,424,514   
   
6,822,752   
   
398,238   
   
54.6   
   
57.9   
   
3.4   
   
Oklahoma   
   
3,970,402   
   
3,995,260   
   
2,420,657   
   
2,570,671   
   
150,014   
   
61.0   
   
64.3   
   
3.4   
   
Oregon   
   
4,229,374   
   
4,238,714   
   
2,409,173   
   
2,572,909   
   
163,736   
   
57.0   
   
60.7   
   
3.7   
   
Pennsylvania   
   
12,989,101   
   
12,986,518   
   
6,570,657   
   
7,114,338   
   
543,681   
   
50.6   
   
54.8   
   
4.2   
   
Puerto Rico   
   
3,272,182   
   
3,254,885   
   
3,272,182   
   
3,254,885   
   
-17,297   
   
100.0   
   
100.0   
   
0.0   
   
Rhode Island   
   
1,094,250   
   
1,095,371   
   
487,452   
   
537,136   
   
49,684   
   
44.5   
   
49.0   
   
4.5   
   
South Carolina   
   
5,142,739   
   
5,212,774   
   
3,722,406   
   
3,906,460   
   
184,054   
   
72.4   
   
74.9   
   
2.6   
   
South Dakota   
   
890,342   
   
899,194   
   
385,527   
   
419,384   
   
33,857   
   
43.3   
   
46.6   
   
3.3   
   
Tennessee   
   
6,923,772   
   
6,986,082   
   
4,282,546   
   
4,871,491   
   
588,945   
   
61.9   
   
69.7   
   
7.9   
   
Texas   
   
29,243,324   
   
29,640,343   
   
17,638,537   
   
18,853,975   
   
1,215,438   
   
60.3   
   
63.6   
   
3.3   
   
Utah   
   
3,283,809   
   
3,331,187   
   
1,967,829   
   
2,120,928   
   
153,099   
   
59.9   
   
63.7   
   
3.7   
   
Vermont   
   
643,816   
   
645,254   
   
258,876   
   
303,002   
   
44,126   
   
40.2   
   
47.0   
   
6.7   
   
Virginia   
   
8,624,506   
   
8,657,499   
   
4,499,306   
   
4,876,738   
   
377,432   
   
52.2   
   
56.3   
   
4.2   
   
Washington   
   
7,688,535   
   
7,740,984   
   
3,731,477   
   
4,133,277   
   
401,800   
   
48.5   
   
53.4   
   
4.9   
   
West Virginia   
   
1,792,967   
   
1,784,462   
   
1,499,694   
   
1,521,816   
   
22,122   
   
83.6   
   
85.3   
   
1.6   
   
Wisconsin   
   
5,882,128   
   
5,892,023   
   
2,722,372   
   
2,963,724   
   
241,352   
   
46.3   
   
50.3   
   
4.0   
   
Wyoming   
   
577,929   
   
579,761   
   
283,529   
   
314,089   
   
30,560   
   
49.1   
   
54.2   
   
5.1   
   
Total   
   
334,287,569   
   
335,562,576   
   
193,659,611   
   
206,240,316   
   
12,580,705   
   
57.6   
   
61.5   
   
3.9   

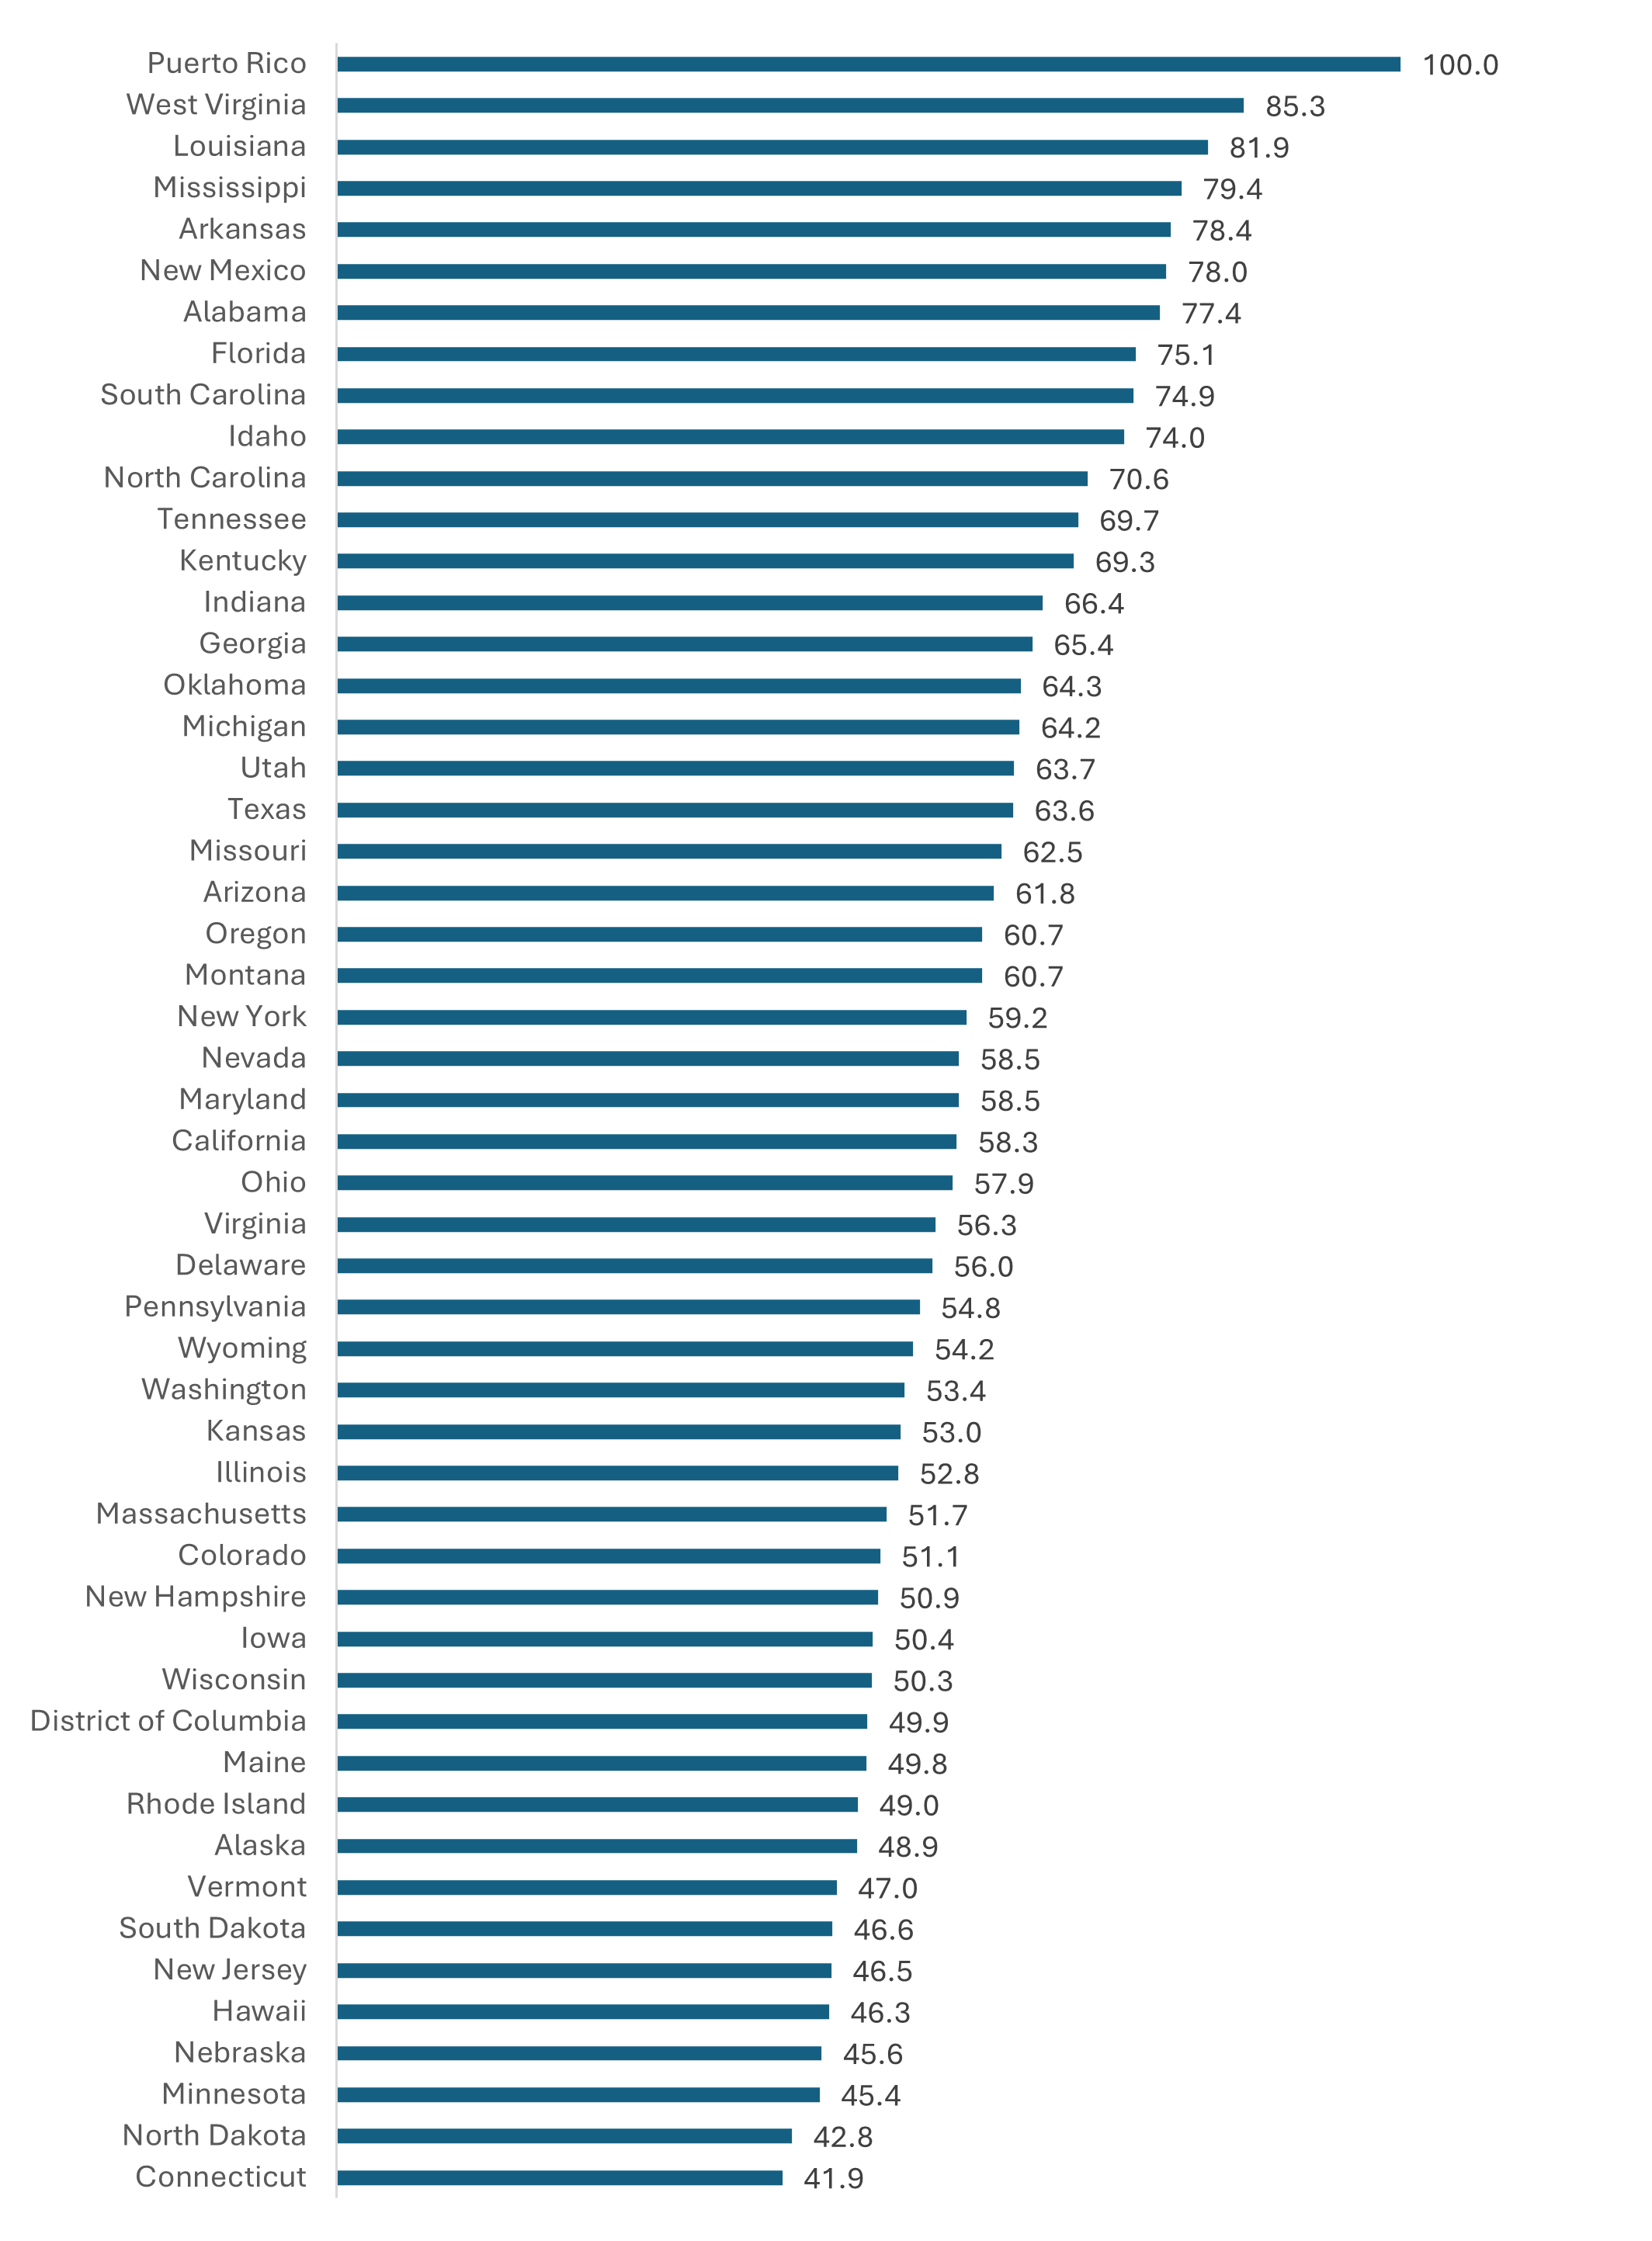
Figure 3 highlights LID qualifying population as a percentage of total population, in descending order across states. The figure highlights that LID qualifying populations are higher in parts of the country with lower per capita incomes, such as Puerto Rico and the South, and are lower in higher income areas, such as the Northeast and Midwest. Other than Puerto Rico, where 100% of residents live in LID qualifying geographies, the highest percentage residing in LID qualifying areas was in West Virginia (85.3%) and the lowest was in Connecticut (41.9%).  

Figure 3: LID qualifying population (% of total population, across states, ranked, 2023)

Figure 3: LID qualifying population ranked by state, 2023

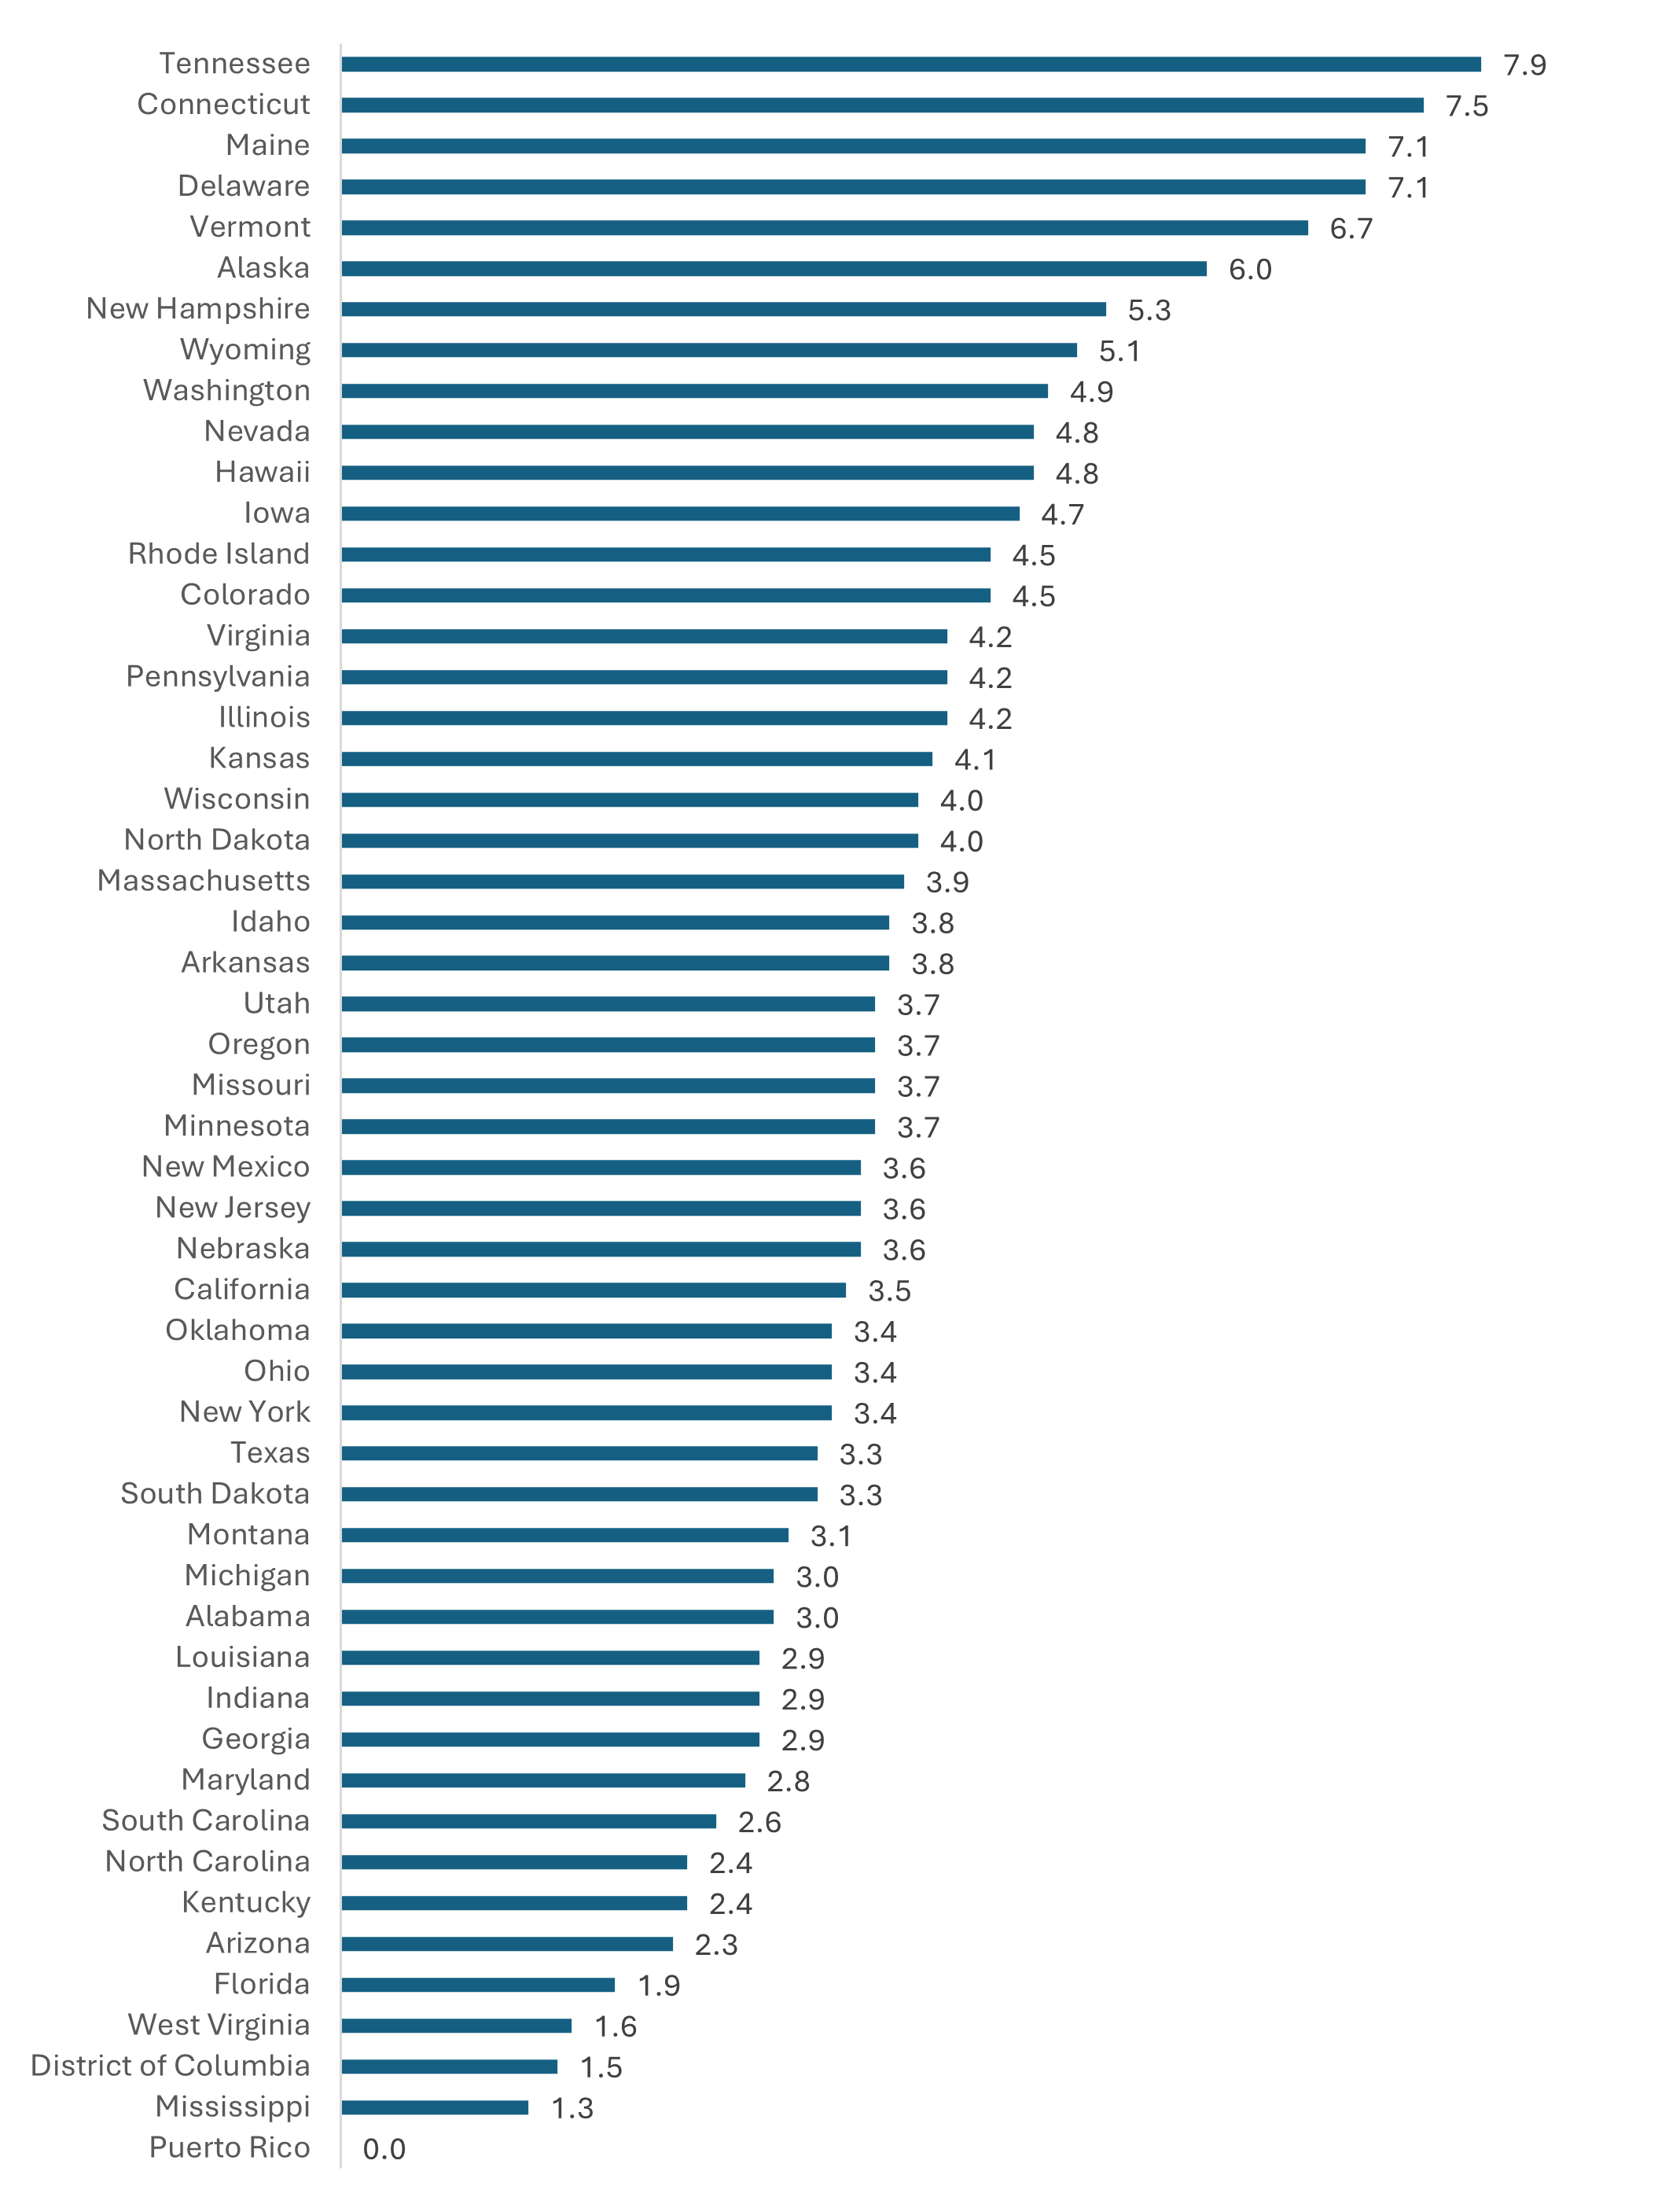
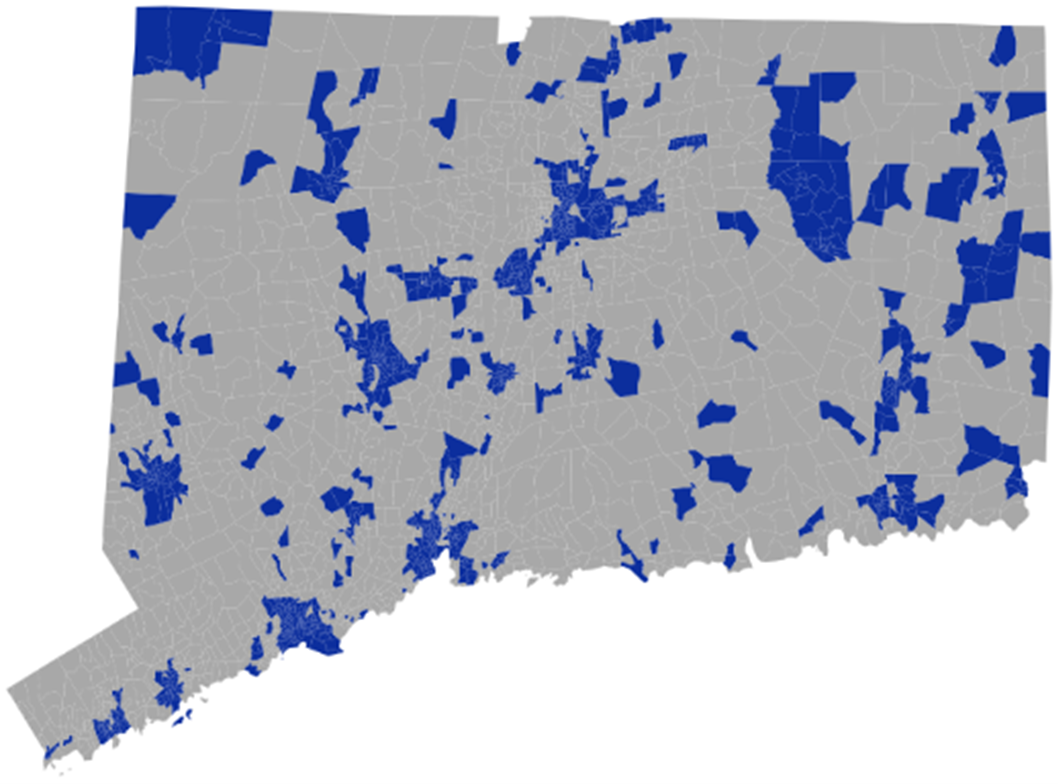
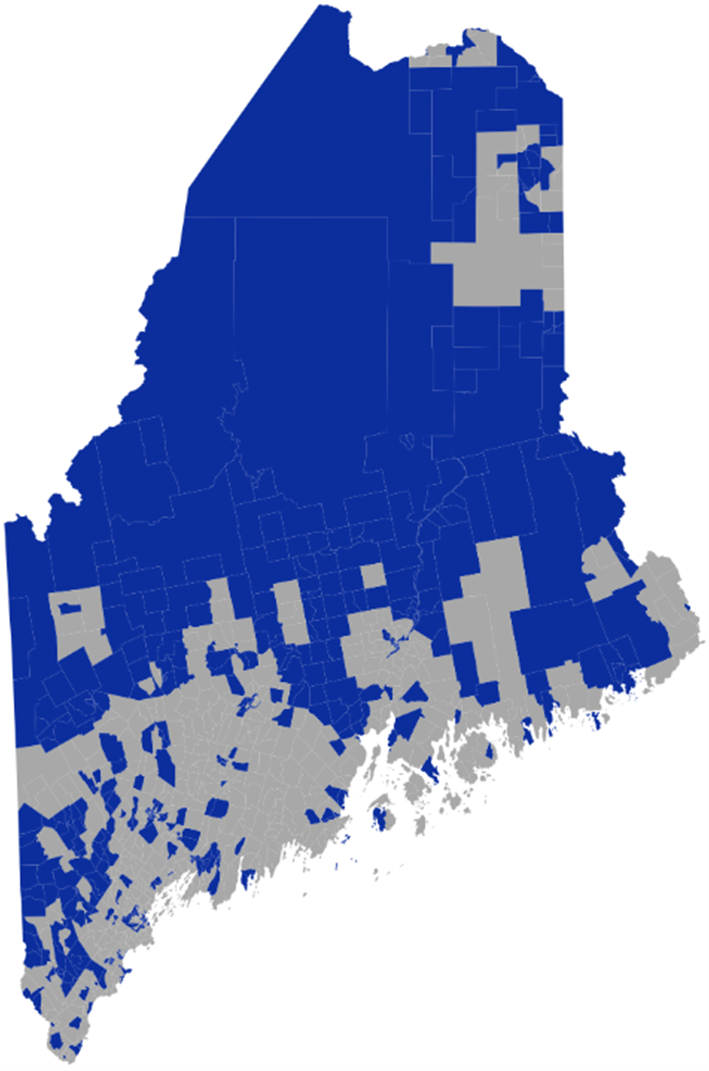
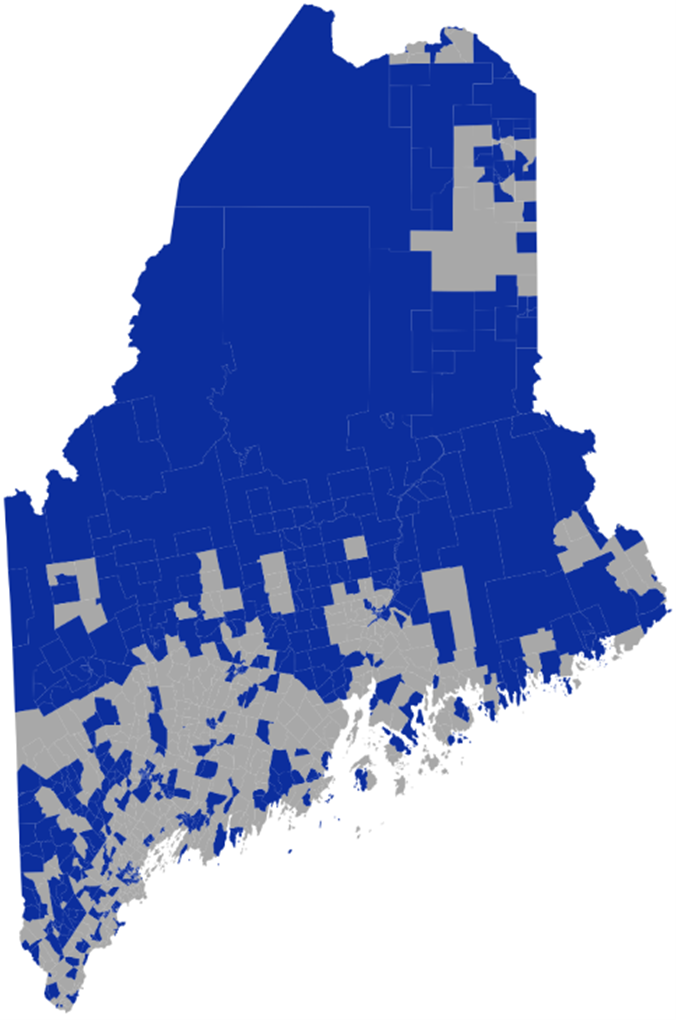
Figure 4 presents the change in the percentage of LID qualifying populations across states during 2022-2023. (Figure 5 presents the same data, in map form.) The fraction increased for every jurisdiction, except Puerto Rico, where it was 100% in both years. The largest increase took place in Tennessee (7.9), but most of the largest increases took place in states that were otherwise high income and that had lower percentages of LID qualifying geographies. For instance, Connecticut saw its LID fraction increase from 34.4% to 41.9% or by 7.5 percentage points. Maine, Vermont, Alaska, and New Hampshire are other states also with low LID fractions that saw among the largest increases in their LID fractions. Credit unions interested in seeking and maintaining their LID status should pay special attention to geographies where LID qualifying fractions increased the most.  

Figure 4: Change in % in LID qualifying population, across states, ranked, 2022-2023

Figure 4: Change in LID qualifying population by state, 2022 to 2023

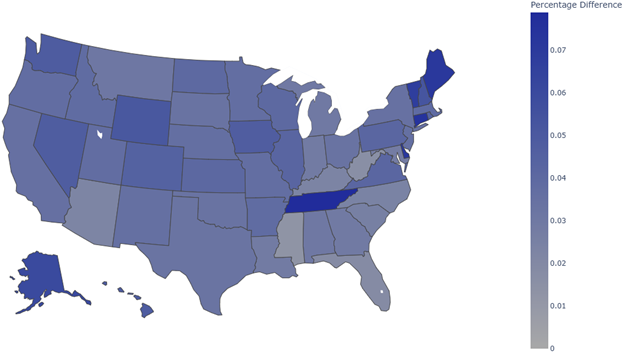
Figure 5 presents a map showing the change in the percentage of LID qualifying population across states from 2022 to 2023.

Figure 5: Map of changes in % of LID qualifying population, across states, 2022-2023

Figure 5: State-level changes in LID qualifying population, ranked by absolute change

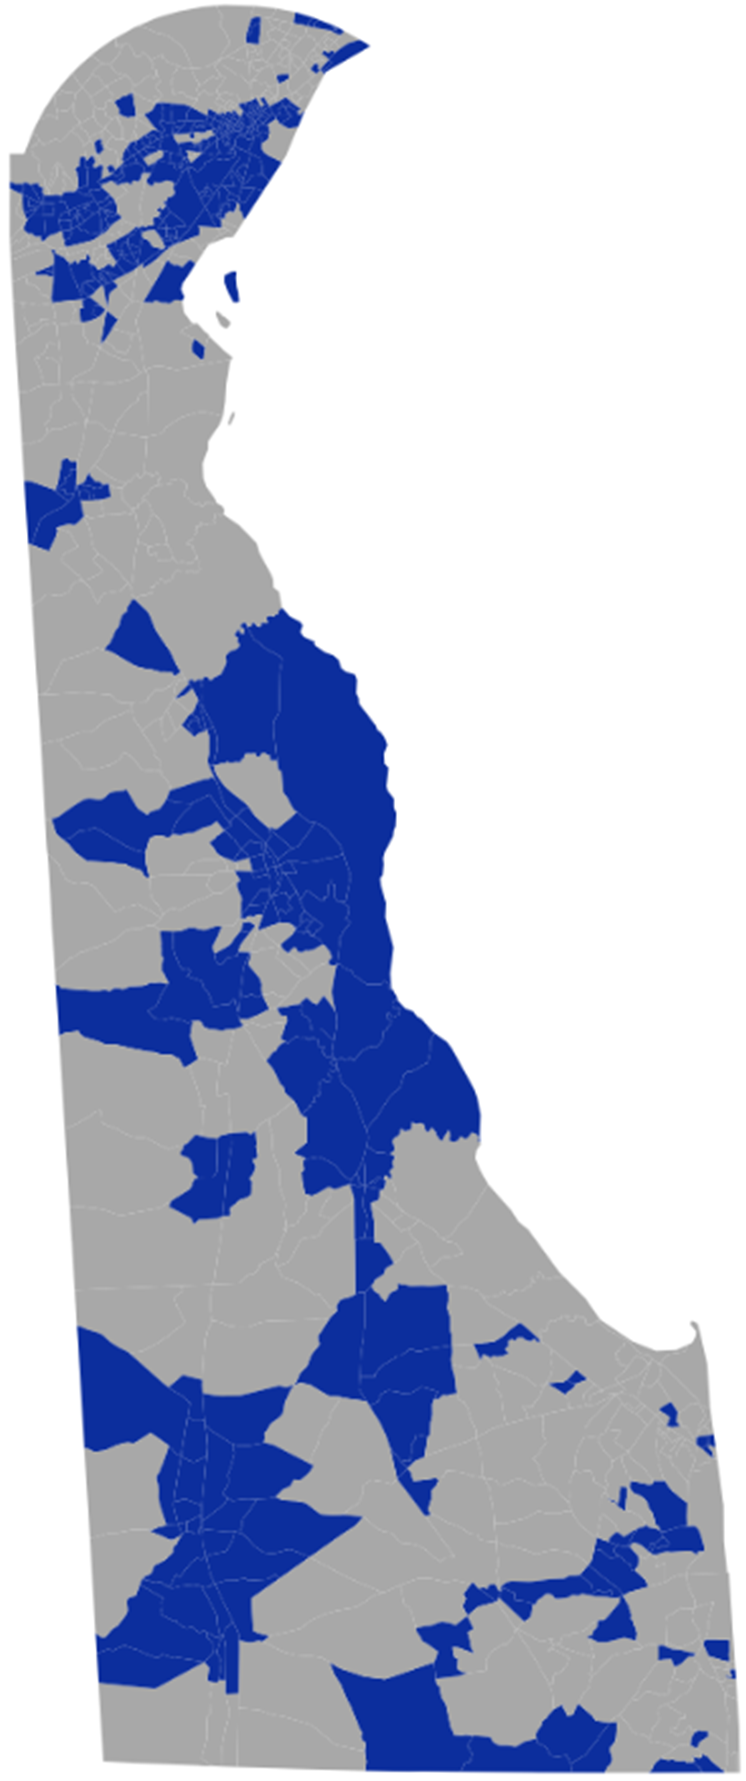
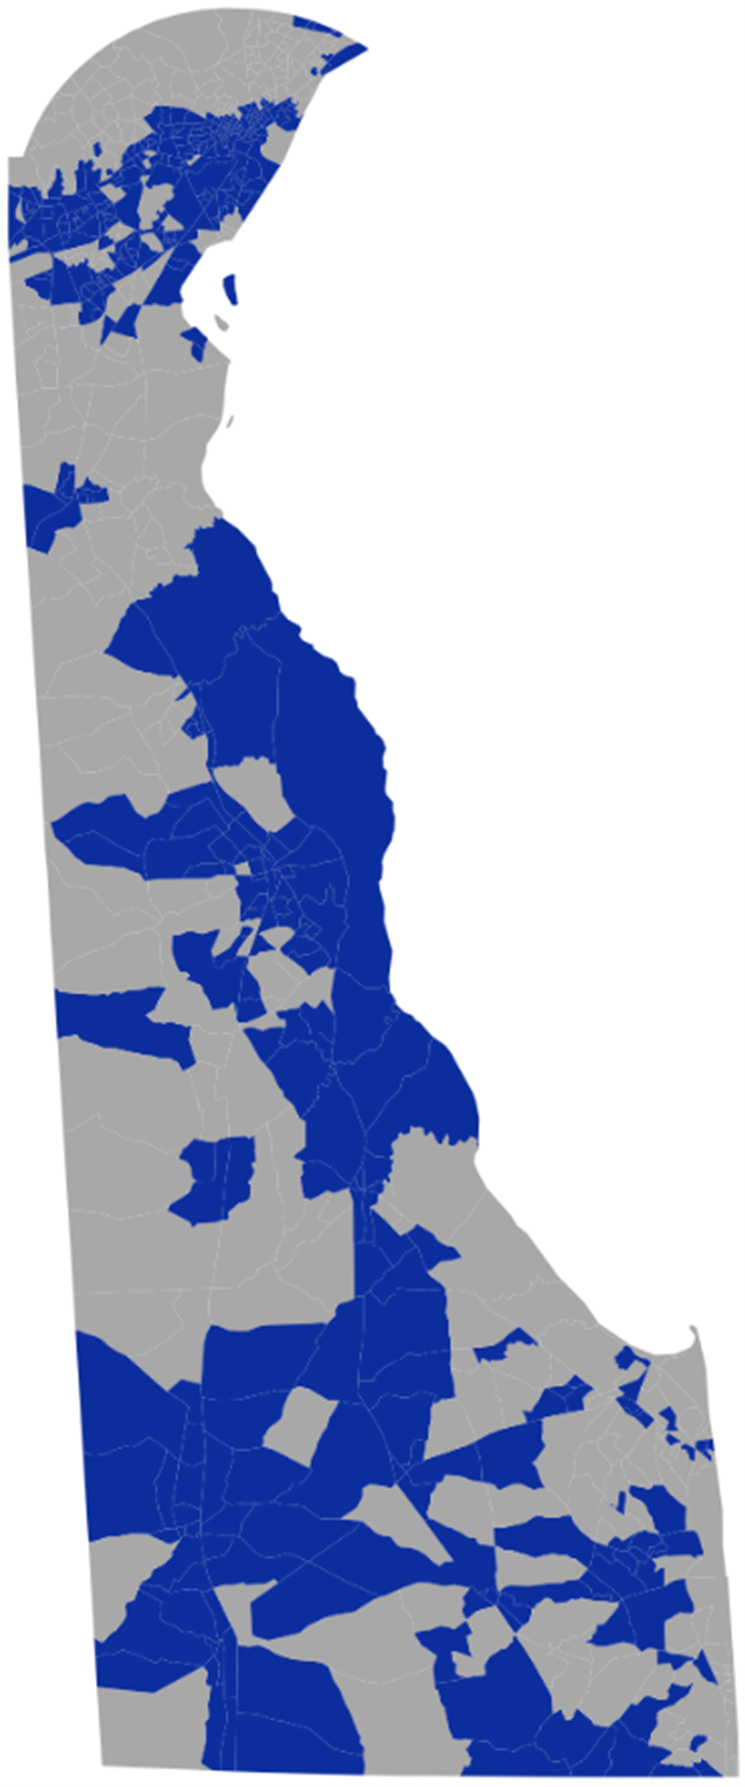
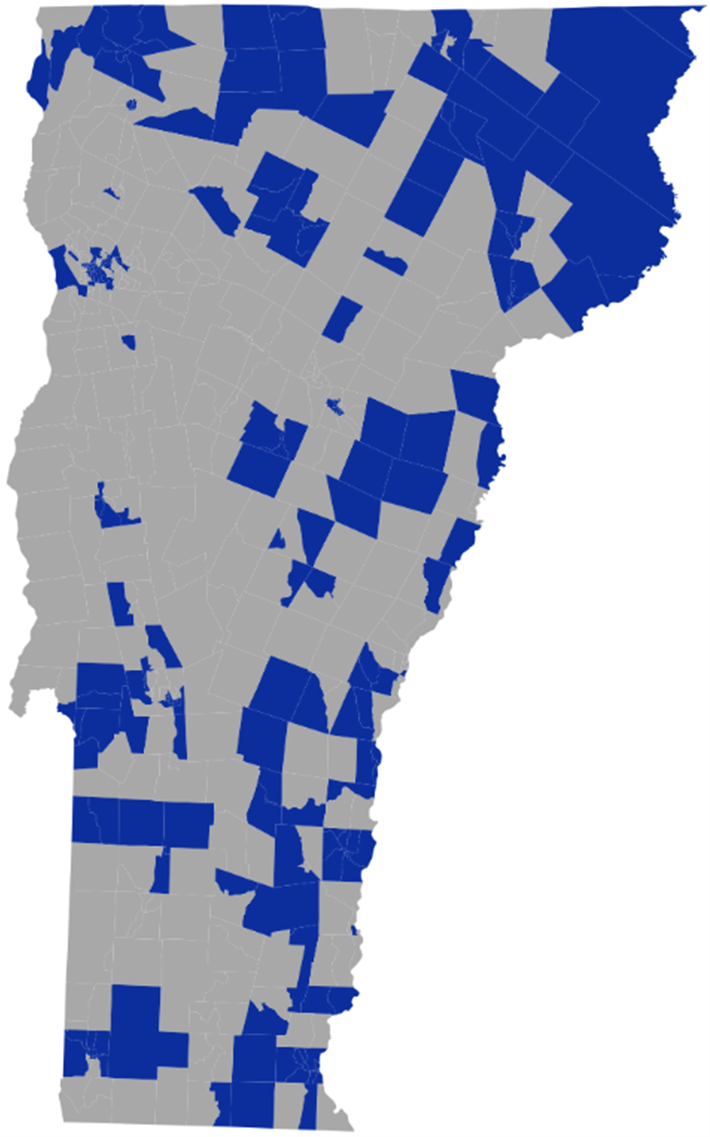
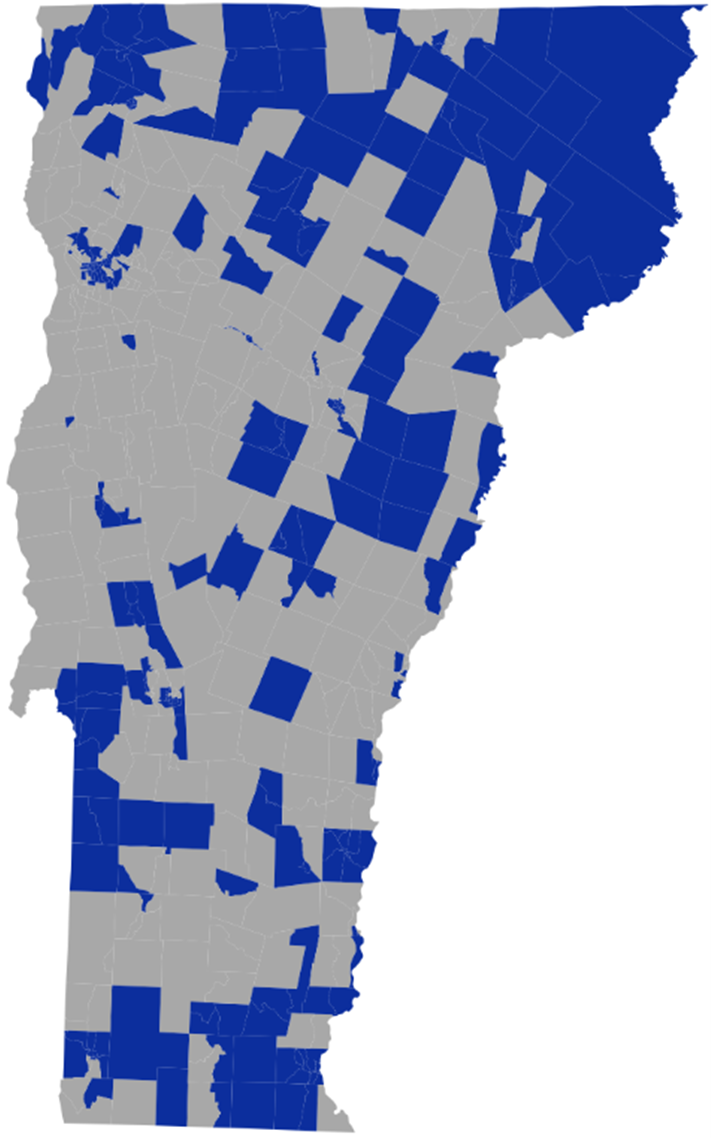
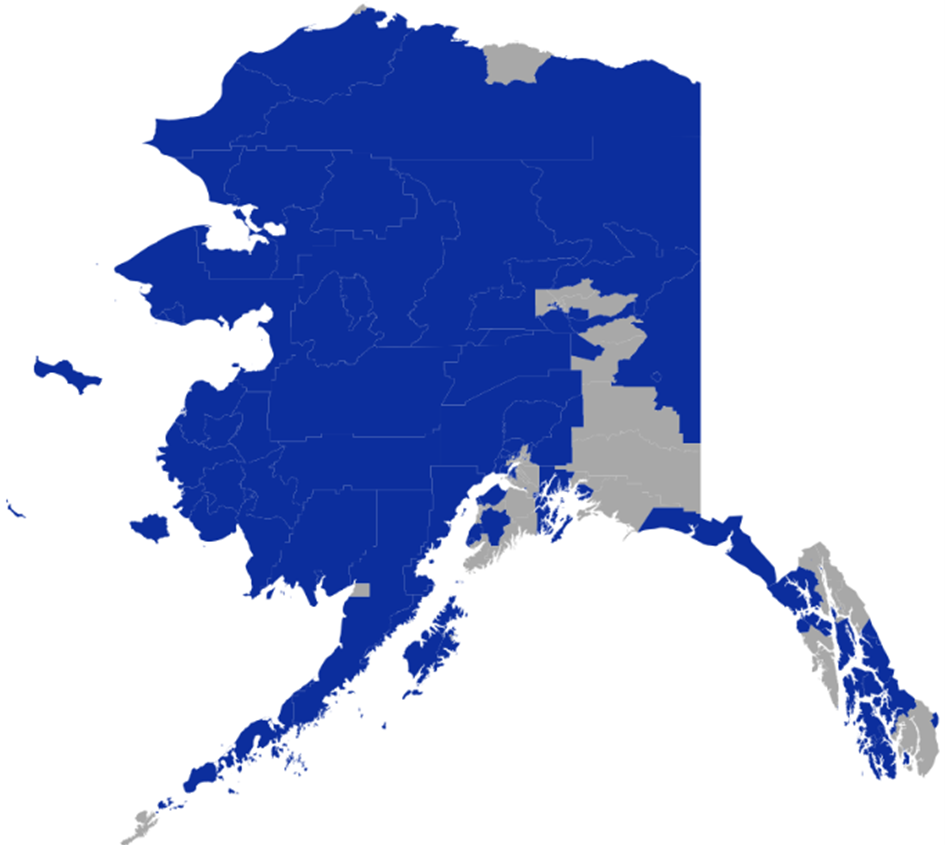
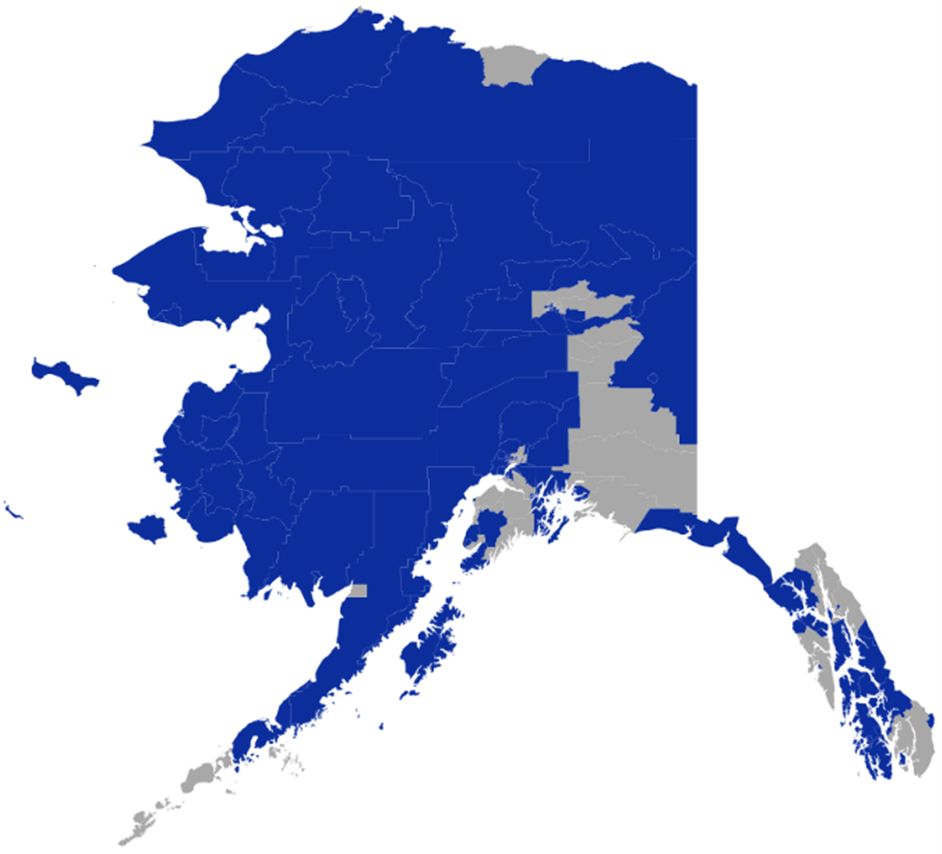
The next set of maps show the specific areas that were LID qualifying in 2022 and 2023, and thus the resulting changes, for the six states with the largest changes: Tennessee, Connecticut, Maine, Delaware, Vermont, and Alaska. Credit unions interested in seeking or maintaining their LID status that have operations, or are interested in operations, in those states should pay special attention to the areas that have recently become LID qualifying.

Finally, some of the largest increases in the number of LID qualifying residents are in states with either large increases in their LID fraction or in states with large total populations. For instance, the number of LID qualifying residents grew by 1.2 million in Tennessee (out of a total population of 7.0 million) and by 1.3 million in California (out of a total population of 39 million).

Figure 6: LID qualifying areas in Tennessee: 2022 vs. 2023

2022: 61.9%

Tennessee LID qualifying areas 2022

2023: 69.7%

Tennessee LID qualifying areas 2023

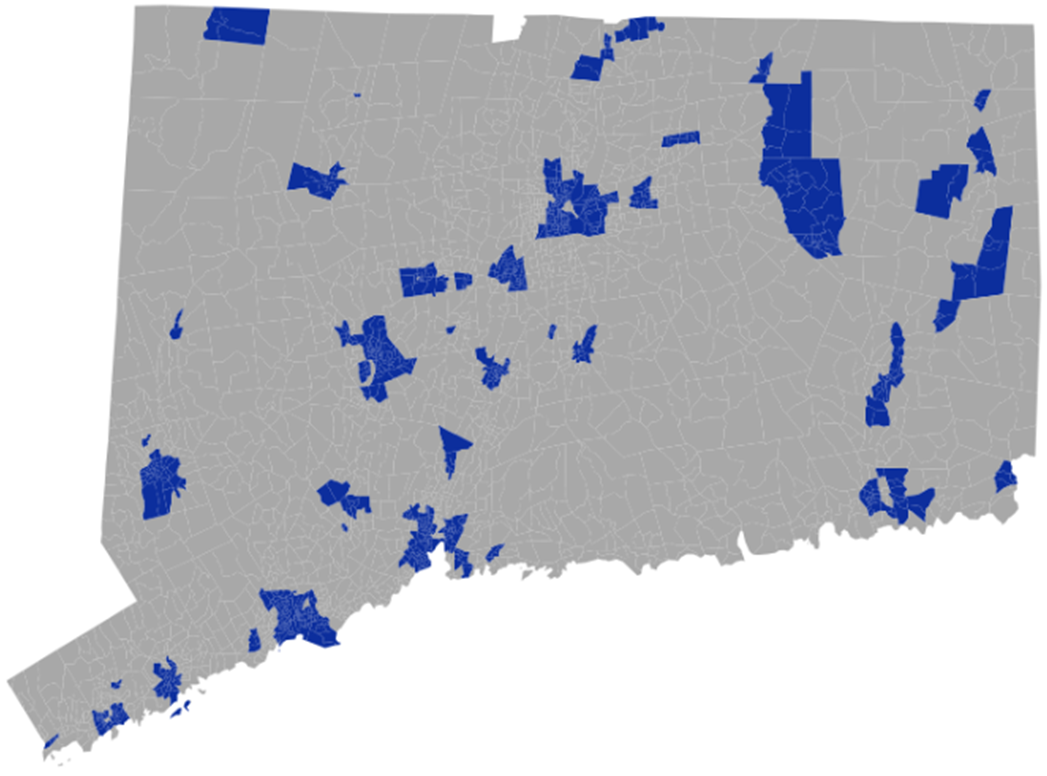
Figure 7: LID qualifying areas in Connecticut: 2022 vs. 2023

2022: 34.4%

Connecticut 2022 LID qualifying areas

2023: 41.9%

Connecticut 2023 LID qualifying areas

Figure 8: LID qualifying areas in Maine: 2022 vs. 2023

2022: 42.7%

Maine 2022 LID qualifying areas

2023: 49.8%

Maine 2023 LID qualifying areas

Figure 9: LID qualifying areas in Delaware: 2022 vs. 2023

2022: 48.9%

Delaware 2022 LID qualifying areas

2023: 56.0%

Delaware 2023 LID qualifying areas

Figure 10: LID qualifying areas in Vermont: 2022 vs. 2023

2022: 40.3%

Vermont 2022 LID qualifying areas

2023: 47.0%

Vermont 2023 LID qualifying areas

Figure 11: LID qualifying areas in Alaska: 2022 vs. 2023

2022: 42.9%

Alaska 2022 LID qualifying areas

2023: 48.9%

Alaska 2023 LID qualifying areas

How the Latest NCUA LID Workbook Update Affects County-Level Eligibility

Figure 12 presents the number of counties and populations thereof that experienced various levels of change in the fraction of their LID qualifying population. The figure shows, again, that the 2025 update of the NCUA LID Area Workbook generally identifies more areas as LID. Relatively few counties (424 or 13.1% of them) experienced declines in their fraction of LID qualifying areas. Moreover, counties that experienced falling fractions of LID qualifying areas were generally very small, accounting for an even smaller fraction of the U.S. population (4.4%).

Figure 12: Changes in LID qualifying areas, across counties, 2022-2023

Ranges of Change in % of LID Qualifying Population Number of Counties % of Number of Counties Total Population % of U.S. Total Population
   
<-5%   
   
202   
   
6.3   
   
4,482,603   
   
1.3   
   
-5% to 0%   
   
220   
   
6.8   
   
10,418,529   
   
3.1   
   
0% to 5%   
   
1,736   
   
53.9   
   
232,249,747   
   
69.2   
   
5% to 10%   
   
483   
   
15.0   
   
69,963,794   
   
20.9   
   
10% to 15%   
   
233   
   
7.2   
   
9,730,831   
   
2.9   
   
>15%   
   
348   
   
10.8   
   
8,717,072   
   
2.6   

A large majority of the U.S. population (69.2%) live in counties that saw either no or moderate changes in their fraction of LID qualifying areas (changing between 0% and 5%). In contrast, large fractions of the U.S. population (26.4%) live in counties that increased their fraction of LID qualifying population by at least 5%. However, while there were many counties (581 or 18% of them) that experienced somewhat large increases in their LID qualifying populations (i.e., of more than 10%), these counties were generally small, accounting for only 5.5% of U.S. population.

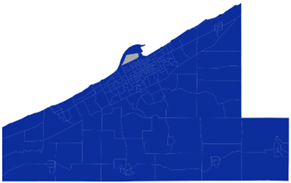
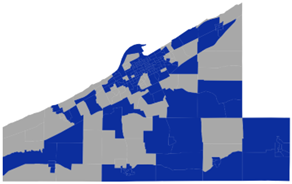
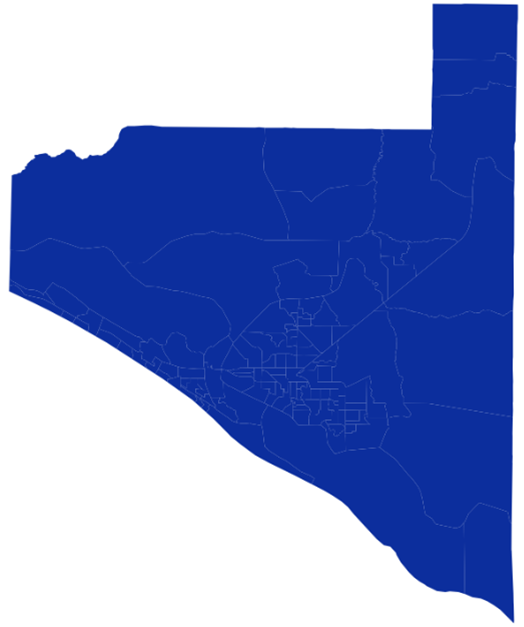
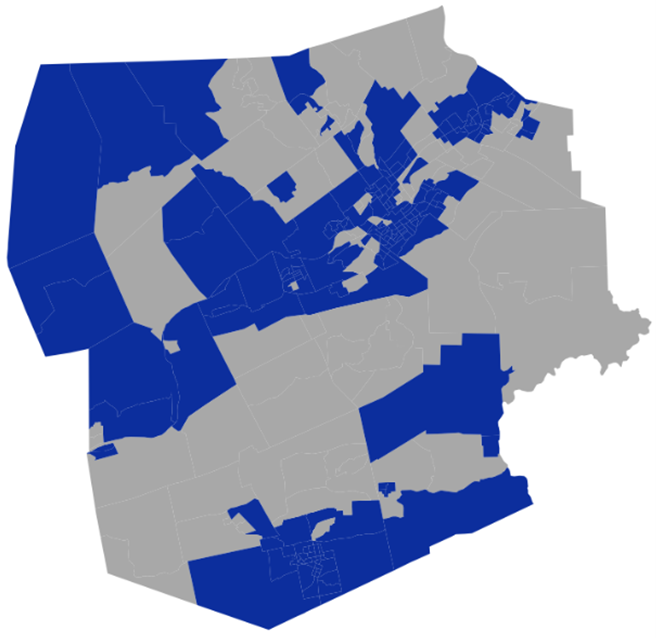
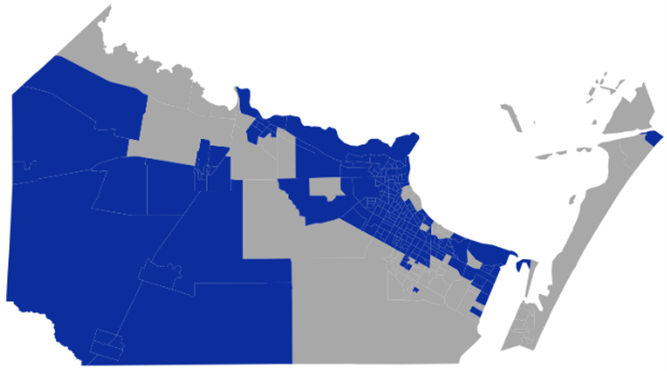
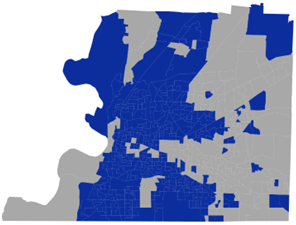
Next, Figures 13-17 present five larger counties that saw large changes (both increases and decreases) in their LID qualifying population with, in each case, changes larger than 50,000 residents and more than 15% of the county’s population. 

Figure 13: Erie County, Pennsylvania: 76,029 fewer LID qualifying residents (-28.2%)

2022: 100%

Erie County 2022 LID qualifying areas

2023: 71.8%

Erie County 2023 LID qualifying areas
Blue = LID qualifying areas
Grey = non-LID qualifying areas

Note: the area marked in grey in 2022 for Erie County was “not LID qualifying” because it covers a body of water and, thus, is uninhabited.

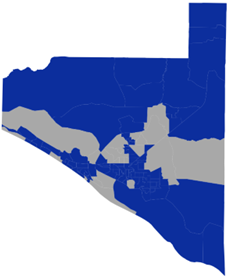
Figure 14: Bay County, Florida: 52,295 fewer LID qualifying residents (-28.8%)

2022: 100%

Bay County 2022 LID qualifying areas

2023: 71.2%

Bay County 2023 LID qualifying areas
Blue = LID qualifying areas
Grey = non-LID qualifying areas

Figure 15: Luzerne County, Pennsylvania: 116,583 more LID qualifying residents (+35.8%)

2022: 74.2%

Luzerne County 2022 LID qualifying areas

2023: 100%

Luzerne County 2023 LID qualifying areas
Blue = LID qualifying areas
Grey = non-LID qualifying areas

Figure 16: Nueces County, Texas: 119,761 more LID qualifying residents (+33.9%)

2022: 66.1%

Nueces County 2022 LID qualifying areas

2023: 100%

Nueces County 2023 LID qualifying areas
Blue = LID qualifying areas
Grey = non-LID qualifying areas

Note: the area marked in grey in 2023 for Nueces County was “not LID qualifying” because it includes an airport and, thus, formally has no residents.

Figure 17: Shelby County, Tennessee: 331,501 more LID qualifying residents (+35.9%)

2022: 64.1%

Shelby County 2022 LID qualifying areas

2023: 100%

Shelby County 2023 LID qualifying areas
Blue = LID qualifying areas
Grey = non-LID qualifying areas

Note: the areas marked in grey in 2023 for Shelby County were “not LID qualifying” because they include parks, airports, and industrial districts; and, thus, formally have no residents.

How We Can Help

CUCollaborate has experts in obtaining and maintaining low-Income designation, in field of membership (FOM) expansion, and in branch market selection. With our expertise, we can help your credit union navigate your low income designation journey, evaluate whether changes in NCUA LID Area workbooks affect you, and adjust your service network and marketing focus to better fit your LID goals. Our mission is to empower credit unions with the insights and tools they need to better serve their members and communities—and to help them compete more effectively in today’s financial landscape.

📅 Click here to schedule time with our team of LID experts.

NCUA